- Posts: 80
- Thank you received: 0
STANDARD CHARTERED PLC, STAN
- tayalsmith1
-
 Topic Author
- Offline
Less
More
10 years 10 months ago #12462
by tayalsmith1
STANDARD CHARTERED PLC, STAN was created by tayalsmith1
INDICATORS
RSI is at 49.60 level with -ve side, in next session downward movement is expected.
MACD and Signal line is below the zero level line.
SELL RECOMDATION
RSI is at 49.60 level with -ve side, in next session downward movement is expected.
MACD and Signal line is below the zero level line.
SELL RECOMDATION
Please Log in or Create an account to join the conversation.
Less
More
- Posts: 634
- Thank you received: 0
10 years 10 months ago - 10 years 10 months ago #12477
by WaveSurfer
Replied by WaveSurfer on topic STANDARD CHARTERED PLC, STAN
What time frame tl ?
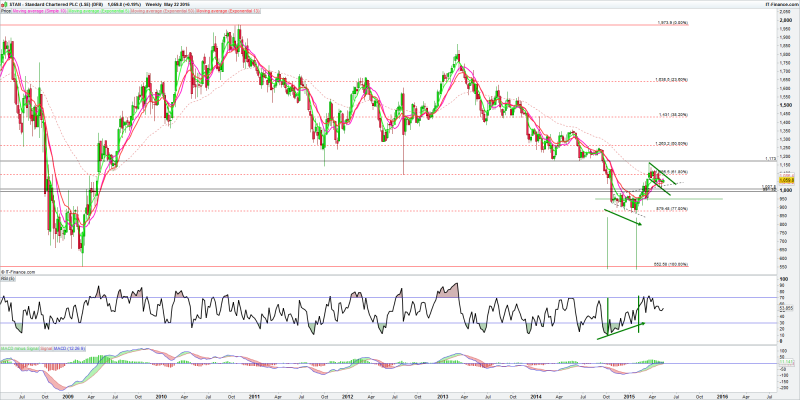
on longer time frame i see something different...and could be worth quite a few points on the upside imo if the formation plays out.
dl.dropboxusercontent.com/u/40497882/Sta...%28DFB%29_Weekly.png
rgds
WS
on longer time frame i see something different...and could be worth quite a few points on the upside imo if the formation plays out.
dl.dropboxusercontent.com/u/40497882/Sta...%28DFB%29_Weekly.png
rgds
WS
Last edit: 10 years 10 months ago by WaveSurfer.
Please Log in or Create an account to join the conversation.
Less
More
- Posts: 519
- Thank you received: 0
10 years 10 months ago #12479
by Food4Thought
Replied by Food4Thought on topic STANDARD CHARTERED PLC, STAN
Looks mixed to me and positive RSI divergence has probably already played itself out.
Is the rise from the low a nice bear flag just starting its descent or does the minor Bull Flag highlighted off that rise indicate a move higher?
I looked up cup and handle after noting the formation on IAE a little while ago and found that it is actually (strictly) a continuation play, not a bottom play; so it should come after an initial rise!
F4T
The following user(s) said Thank You: WaveSurfer
Please Log in or Create an account to join the conversation.
Less
More
- Posts: 634
- Thank you received: 0
10 years 10 months ago - 10 years 10 months ago #12480
by WaveSurfer
Replied by WaveSurfer on topic STANDARD CHARTERED PLC, STAN
maybe both, a bull flag within a bear flag, yes very possible.
as for continuation longer term, this needs to start making higher highs, unitl then it remains in a downtrend, however stan has had its best move up in points since mar2013, since the recent lows.
I'll be watching this pull-back with great interest, and if it puts in higher low or not will dictate its
course..
if it does, then - initial upside target around 1264, 1340/50,
if it does not and the recent lows get taken then a retest to 2009 lows possible.
rgds WS
Last edit: 10 years 10 months ago by WaveSurfer.
Please Log in or Create an account to join the conversation.
- tayalsmith1
-
Topic Author
- Offline
Less
More
- Posts: 80
- Thank you received: 0
10 years 10 months ago #12481
by tayalsmith1
Replied by tayalsmith1 on topic STANDARD CHARTERED PLC, STAN
This stock was showing wave type indicators. Creating support level of 1055
But if it breaks the support level of 1055 it can show selling strength.
But if it breaks the support level of 1055 it can show selling strength.
Please Log in or Create an account to join the conversation.
Less
More
- Posts: 519
- Thank you received: 0
10 years 10 months ago #12483
by Food4Thought
Replied by Food4Thought on topic STANDARD CHARTERED PLC, STAN
What are "wave type indicators"?
Please Log in or Create an account to join the conversation.
Moderators: remo
Time to create page: 0.177 seconds